Reverse engineering MLB Gameday - Part 2 - Batter’s heatmap
This is a multipart series:
- Part 0 - An introduction
- Part 1 - Pitch data
- Part 2 (this post) - Batter’s heatmap
The source code is available on Github
Heatmap
The heatmap is the strike zone broken up into nine smaller rectangles in a 3x3 grid. Each smaller rectangle is used to convey how good the batter is, as measured by their batting average, at hitting a pitch in that area. A high batting average is colored red, a low average is blue, and then there are shades in between.
Below are two screen shots showing a heatmap for different players. The first one is for a pitcher, who expectedly has a pretty blue looking heatmap. The second is for a regular position player, and can be seen by the difference in blue areas, is a much better hitter.
Also of note - the first pitch in the position player’s heatmap was thrown in his only blue zone. Pitchers are absolutely aware of this information and its part of their game plan to pitch to lower average areas (which makes sense, right?).
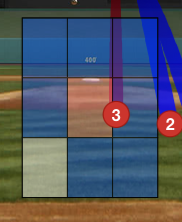
Screen shot taken from MLB Gameday showing a pitcher’s heatmap.
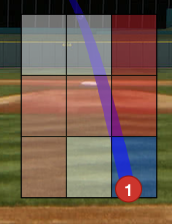
Screen shot taken from MLB Gameday showing a position player’s heatmap.
While looking through the json to find the pitch information (as described in part 1), I also realized that this heatmap information is included too.
Without further ado, let’s dig into some more json.
raw data
As with the pitch data from part 1, the data for the heatmap is stored in the
currentPlay section of the json from the v1.1/game/{game-pk}/feed/live [0]
endpoint. However, instead of diving into the playEvents, we will be exploring
the matchup section this time.
If we look at the json below, there are two sections that stand out:
batterHotColdZoneStats
batterHotColdZones
I cut out the
zonesin thebatterHotColdZoneStatsin order to make the json smaller, they look like thezonesarray inbatterHotColdZones.
{
    "matchup": {
        "batter": {
            "id": 405395,
            "fullName": "Albert Pujols",
            "link": "/api/v1/people/405395"
        },
        "batSide": {
            "code": "R",
            "description": "Right"
        },
        "pitcher": {
            "id": 650556,
            "fullName": "Bryan Abreu",
            "link": "/api/v1/people/650556"
        },
        "pitchHand": {
            "code": "R",
            "description": "Right"
        },
        "batterHotColdZoneStats": {
            "stats": [
                {
                    "type": {
                        "displayName": "hotColdZones"
                    },
                    "group": {
                        "displayName": "hitting"
                    },
                    "exemptions": [],
                    "splits": [
                        {
                            "stat": {
                                "name": "onBasePlusSlugging",
                                "zones": [ ]
                            }
                        },
                        {
                            "stat": {
                                "name": "exitVelocity",
                                "zones": [ ]
                            }
                        },
                        {
                            "stat": {
                                "name": "battingAverage",
                                "zones": [ ]
                            }
                        }
                    ]
                }
            ]
        },
        "batterHotColdZones": [
            {
                "zone": "01",
                "color": "rgba(150, 188, 255, .55)",
                "temp": "cool",
                "value": ".571"
            },
            {
                "zone": "02",
                "color": "rgba(255, 255, 255, 0.55)",
                "temp": "lukewarm",
                "value": ".909"
            },
            {
                "zone": "03",
                "color": "rgba(214, 41, 52, .55)",
                "temp": "hot",
                "value": "1.333"
            },
            {
                "zone": "04",
                "color": "rgba(214, 41, 52, .55)",
                "temp": "hot",
                "value": "1.154"
            },
            {
                "zone": "05",
                "color": "rgba(6, 90, 238, .55)",
                "temp": "cold",
                "value": ".389"
            },
            {
                "zone": "06",
                "color": "rgba(214, 41, 52, .55)",
                "temp": "hot",
                "value": "1.167"
            },
            {
                "zone": "07",
                "color": "rgba(255, 255, 255, 0.55)",
                "temp": "lukewarm",
                "value": ".667"
            },
            {
                "zone": "08",
                "color": "rgba(255, 255, 255, 0.55)",
                "temp": "lukewarm",
                "value": ".840"
            },
            {
                "zone": "09",
                "color": "rgba(6, 90, 238, .55)",
                "temp": "cold",
                "value": ".308"
            },
            {
                "zone": "11",
                "color": "rgba(255, 255, 255, 0.55)",
                "temp": "lukewarm",
                "value": ".750"
            },
            {
                "zone": "12",
                "color": "rgba(150, 188, 255, .55)",
                "temp": "cool",
                "value": ".632"
            },
            {
                "zone": "13",
                "color": "rgba(6, 90, 238, .55)",
                "temp": "cold",
                "value": ".500"
            },
            {
                "zone": "14",
                "color": "rgba(6, 90, 238, .55)",
                "temp": "cold",
                "value": ".469"
            }
        ],
        "pitcherHotColdZones": [],
        "splits": {
            "batter": "vs_RHP",
            "pitcher": "vs_RHB",
            "menOnBase": "Empty"
        }
    }
}
As can be guessed, the information needed is in the batterHotColdZones
section.
A keen reader might have noticed the zone field, and might have noticed that
there are 13 zones (where did zone 10 go?). As can be seen from the screen shots
at the start of this post, there are only nine zones.
These four extra zones are a mystery.
Let’s not get caught up with mysteries, we have json to parse!
You may also be wondering why not use the other section,
batterHotColdZoneStats? Well, after cross referencing with a live game in
Gameday, I determined that they are showing the batting average and not
on base plus slugging or exit velocity. This actually makes the parsing a
little bit easier, so I was happy to go with it.
I’m only interested in the colors of the zones, so we actually end up with a nice and neat json. Here’s it stripped down with what we need to parse in Rust:
I don’t actually strip the json, this is just for illustrative purposes.
{
    "matchup": {
        "batterHotColdZones": [
            {
                "color": "rgba(150, 188, 255, .55)"
            },
            {
                "color": "rgba(255, 255, 255, 0.55)"
            },
            {
                "color": "rgba(214, 41, 52, .55)"
            },
            {
                "color": "rgba(214, 41, 52, .55)"
            },
            {
                "color": "rgba(6, 90, 238, .55)"
            },
            {
                "color": "rgba(214, 41, 52, .55)"
            },
            {
                "color": "rgba(255, 255, 255, 0.55)"
            },
            {
                "color": "rgba(255, 255, 255, 0.55)"
            },
            {
                "color": "rgba(6, 90, 238, .55)"
            },
            {
                "color": "rgba(255, 255, 255, 0.55)"
            },
            {
                "color": "rgba(150, 188, 255, .55)"
            },
            {
                "color": "rgba(6, 90, 238, .55)"
            },
            {
                "color": "rgba(6, 90, 238, .55)"
            }
        ]
    }
}
Displaying the heatmap
Besides mysterious zones, this is going quite smoothly compared to the pitches from part 1! Up next is parsing the data with Rust, and then rendering the heatmap to the terminal.
Rust
I use a simple struct to parse out the color from the json, discarding the rest. Some abbreviated code is shown below while the full source can be found here.
This type of parsing really highlights a couple of Rust’s standout strengths, error handling and iterators.
Without going into detail about the structs coming back from the API (which is
where the json is actually parsed using serde), I can
safely extract the needed zones or return a default heatmap. If the zones are
present, I call transform_zones and
map over
them to convert the string into a tui-rs
Color.
Clean, robust, and fast.
// src/strikezone.rs
pub struct StrikeZone {
    pub colors: Vec<Color>,
    pub strike_zone_bot: f64,
    pub strike_zone_top: f64,
}

impl StrikeZone {
    pub fn new(colors: Vec<Color>) -> Self {
        StrikeZone {
            colors,
            strike_zone_bot: DEFAULT_SZ_BOT,
            strike_zone_top: DEFAULT_SZ_TOP,
        }
    }

    /// Generate the strike zone from the current at bat. If there is no data the strike zone will
    /// be all black.
    ///
    /// To get to the heat map zones, the API response is traversed like so:
    /// liveData > plays > currentPlay > matchup > batterHotColdZones > zones
    pub fn from_live_data(live_game: &LiveResponse) -> Self {
        let colors = match live_game.live_data.plays.current_play.as_ref() {
            Some(c) => match c.matchup.batter_hot_cold_zones.as_ref() {
                Some(z) => StrikeZone::transform_zones(z),
                None => return StrikeZone::default(),
            },
            None => return StrikeZone::default(),
        };
        if colors.len() < 9 {
            return StrikeZone::default();
        }
        StrikeZone::new(colors)
    }

    /// Go through the zones and pull out the batting average colors. There are usually 13 zones
    /// that are supplied, although I'm unsure why there are that many. I am only using the first 9
    /// to create a 3x3 heatmap. My theory is that the last 4 are used for coloring the edges of the
    /// real heatmap shown on MLB Gameday?
    fn transform_zones(zones: &[Zone]) -> Vec<Color> {
        zones
            .iter()
            .map(|z| convert_color(z.color.clone()))
            .collect()
    }
// src/util.rs
use tui::style::Color;

/// Convert a string from the API to a Color::Rgb. The string starts out as:
/// "rgba(255, 255, 255, 0.55)".
pub(crate) fn convert_color(s: String) -> Color {
    if let Some(s) = s.strip_prefix("rgba(") {
        let c: Vec<&str> = s.split(", ").collect();
        Color::Rgb(
            c[0].parse().unwrap_or(0),
            c[1].parse().unwrap_or(0),
            c[2].parse().unwrap_or(0),
        )
    } else {
        eprintln!("color doesn't start with 'rgba(' {:?}", s);
        Color::Rgb(0, 0, 0)
    }
}
coordinates
If you followed along in part 1, you probably remember the pitch coordinates and having to figure out what they meant and where to place them. They were in the json, so they had to be dealt with up front. On the other hand, the heatmap had no notion of position. It was just a straight forward parsing job.
Well, unfortunately now is the time to figure out where to put these colors.
#TODO it was kind of tedious, so I’ll write about it later
[0] - https://statsapi.mlb.com/api/v1.1/game/634021/feed/live