Reverse engineering MLB Gameday - Part 1 - Pitch data
This is a multipart series:
- Part 0 - An introduction
- Part 1 (this post) - Pitch data
- Part 2 - Batter’s heatmap
The source code is available on Github
Pitch data
MLB’s Statcast provides a wealth of information for every pitch, which powers both Gameday and the strike zone graphic during live TV games. The goal I have with the pitch data is to replicate the Gameday view and display pitches overlaid on the strike zone. To accomplish this the pitch location needs to be shown, as well as speed, pitch type (fastball, curve, ect.), and outcome (called strike, foul, hit, ect.).
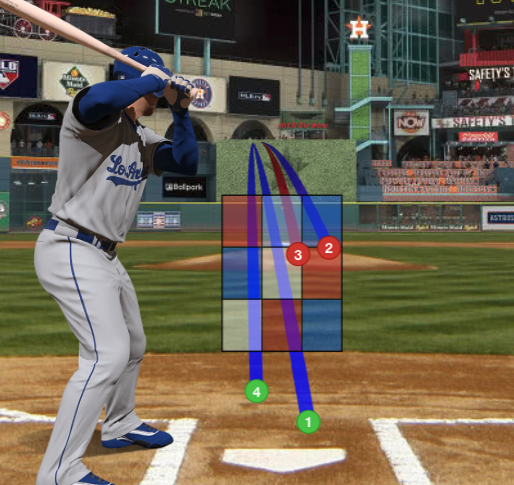
Screen shot taken from MLB Gameday, showing pitches overlaid on a batter’s heatmap.
The data in question comes in from the v1.1/game/{game-pk}/feed/live [0]
endpoint, along with a whole lot of other information. When a nine inning game
is over, this endpoint returns north of 40,000 lines of json. Included is every
play and every pitch. Luckily, there is a section for the currentPlay which
only contains the information regarding the current batter.
raw data
Top level, this data looks like:
{
  "currentPlay": {
    "result" : {},
    "about" : {},
    "count" : {},
    "matchup" : {},
    "pitchIndex" : [],
    "actionIndex" : [],
    "runnerIndex" : [],
    "runners": [],
    "playEvents" : [],
    "atBatIndex" : 1,
    "playEndTime" : ""
  }
}
With the interesting information contained in playEvents. Each item in this
array is an event during the current at bat. This includes the pitches and
information about them, but also normal plays like a stolen base, pick off
attempt, ect. Let’s look at a pitch event:
{
    "details": {
      "call": {
        "code": "*B",
        "description": "Ball In Dirt"
      },
      "description": "Ball In Dirt",
      "code": "*B",
      "ballColor": "rgba(39, 161, 39, 1.0)",
      "trailColor": "rgba(0, 0, 254, 1.0)",
      "isInPlay": false,
      "isStrike": false,
      "isBall": true,
      "type": {
        "code": "SL",
        "description": "Slider"
      },
      "hasReview": false
    },
    "count": {
      "balls": 1,
      "strikes": 0,
      "outs": 2
    },
    "pitchData": {
      "startSpeed": 88.6,
      "endSpeed": 81.6,
      "strikeZoneTop": 3.49,
      "strikeZoneBottom": 1.6,
      "coordinates": {
        "aY": 27.1,
        "aZ": -31.21,
        "pfxX": 0.15,
        "pfxZ": 0.57,
        "pX": 1.53,
        "pZ": 0.72,
        "vX0": 8.21,
        "vY0": -128.65,
        "vZ0": -6.34,
        "x": 58.59,
        "y": 219.43,
        "x0": -1.72,
        "y0": 50.0,
        "z0": 5.64,
        "aX": 0.24
      },
      "breaks": {
        "breakAngle": 3.6,
        "breakLength": 8.4,
        "breakY": 24.0,
        "spinRate": 2423,
        "spinDirection": 24
      },
      "zone": 14,
      "typeConfidence": 0.9,
      "plateTime": 0.43,
      "extension": 6.22
    },
    "index": 1,
    "playId": "ca063f74-f034-455f-9016-d35ce2d895db",
    "pitchNumber": 1,
    "startTime": "2021-05-27T02:44:52.096Z",
    "endTime": "2021-05-27T02:44:56.590Z",
    "isPitch": true,
    "type": "pitch"
}
As you can see, a lot of information is provided for a single pitch. (That 40K line json starting to make sense now?)
The things I’m interested in for the display are:
- call
- description
- ballColor
- type
- count
- pitchNumber
- pitchData
- startSpeed
- strikeZoneTop
- strikeZoneBottom
- coordinates
Here’s a json with only those items:
{
  "details": {
    "call": {
      "code": "*B",
      "description": "Ball In Dirt"
    },
    "description": "Ball In Dirt",
    "ballColor": "rgba(39, 161, 39, 1.0)",
    "type": {
      "code": "SL",
      "description": "Slider"
    }
  },
  "count": {
    "balls": 1,
    "strikes": 0,
    "outs": 2
  },
  "pitchData": {
    "startSpeed": 88.6,
    "strikeZoneTop": 3.49,
    "strikeZoneBottom": 1.6,
    "coordinates": {
      "aY": 27.1,
      "aZ": -31.21,
      "pfxX": 0.15,
      "pfxZ": 0.57,
      "pX": 1.53,
      "pZ": 0.72,
      "vX0": 8.21,
      "vY0": -128.65,
      "vZ0": -6.34,
      "x": 58.59,
      "y": 219.43,
      "x0": -1.72,
      "y0": 50.0,
      "z0": 5.64,
      "aX": 0.24
    }
  },
  "pitchNumber": 1
}
Now this is starting to look more like information you get from watching the game live; you know the count, the call, the outcome (description), and pitch speed (in MPH). But what are those coordinates? And strike zone top/bottom? This is where things start to get interesting.
pitch location
Let’s break this down piece by piece.
startSpeed - the speed of the pitch in MPH. Interestingly, at first I thought
to display the endSpeed, but after cross referencing with a live game,
the startSpeed is actually what matters.
strikeZoneTop and strikeZoneBottom - these are dimensions in feet that
make up the top and bottom of the strike zone. You might be wondering, what
about the left/right dimensions? More on this later, in part 2.
coordinates - alright, now things are starting to get weird. To refresh, I’m
interested in the location of the ball when it crosses the plate. At first
glance, I thought it was the x and y coordinates; however, it’s actually
the pX and pZ coordinates.
coordinate system
A little detour to explain the coordinate system is in order. First, imagine yourself the catcher, squatting down behind the plate, looking at the pitcher. Now the:
- x coordinate is from left to right
- z coordinate is from the ground to the sky
- y coordinate is from you to the pitcher
Don’t ask me why these are they way they are. An awesome blog post [1] clued me in:
… MLB’s standard coordinate system, where the y-axis points toward the pitcher’s mound from the back of home plate, the z-axis points directly up from the back of home plate, and the x-axis is orthogonal to the other two axes.
And baseball savant [2] put the nail in the coffin (and explains a lot of the other coordinate values):
plate_x - Horizontal position of the ball when it crosses home plate from the catcher’s perspective.
plate_z - Vertical position of the ball when it crosses home plate from the catcher’s perspective.
Great! The fully stripped down json looks like:
{
  "details": {
    "call": {
      "code": "*B",
      "description": "Ball In Dirt"
    },
    "description": "Ball In Dirt",
    "ballColor": "rgba(39, 161, 39, 1.0)",
    "type": {
      "code": "SL",
      "description": "Slider"
    }
  },
  "pitchData": {
    "startSpeed": 88.6,
    "strikeZoneTop": 3.49,
    "strikeZoneBottom": 1.6,
    "coordinates": {
      "pX": 1.53,
      "pZ": 0.72
    }
  },
  "pitchNumber": 1
}
Displaying the pitches
Now with all the information about the pitch it is time to display it in the terminal.
The goal is to display a pitch, its pitch index, and the color overlayed on the batter’s heat map (which is discussed in part 2). The TUI display is shown below with a comparison to a pitch chart from baseball savant [3]. As can be seen, the pitch locations are essentially identical. This is a good sign because they use the same data.
Screen shot taken from Screen shot taken from Baseball Savant.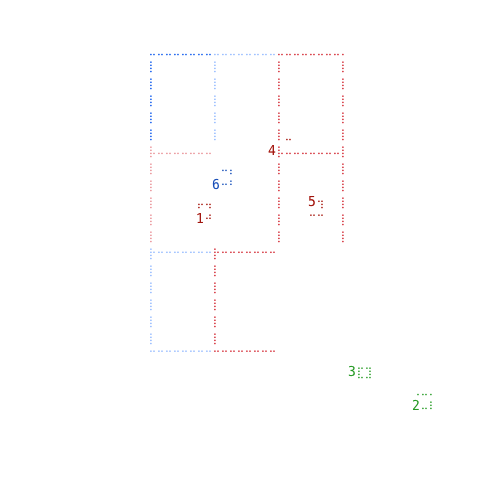
mlbt.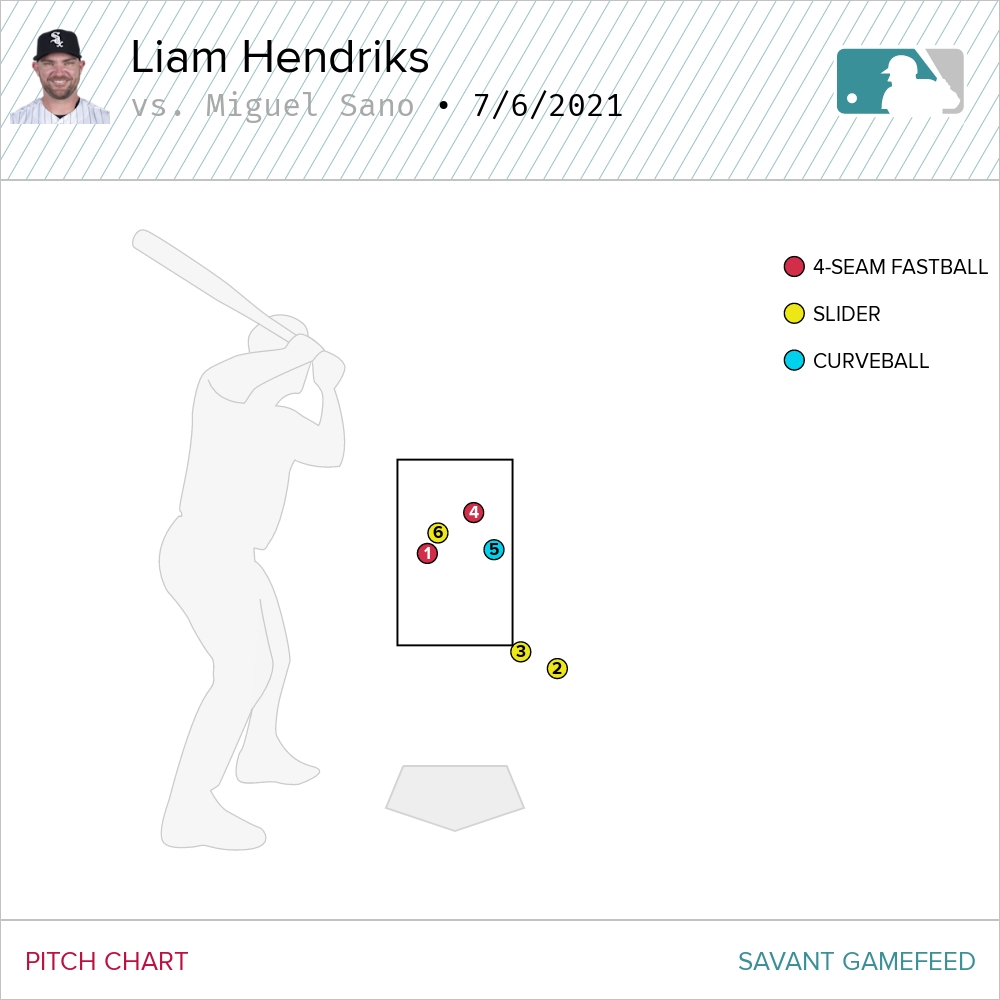
So, how did we get from the json to the display? You may have noticed in the
screen shot from mlbt that the pitches are actually displayed as rectangles.
In tui-rs, it’s quite easy to render various basic shapes on the terminal
using the available primitives. I opted for the
rectangle
after trying to render a circle using only point primitives (which didn’t look
great and was pretty inconsistent in how circular it would be).
After the hard work of parsing the json and figuring out what data to use, the rest is relatively straight forward.
Rust
Let’s take a step back (or forward?) and look at how a pitch is represented in
Rust. I use a struct, Pitch, which pretty closely matches the json above. The
full parsing code can be found
here.
#[derive(Debug)]
pub struct Pitch {
    pub strike: bool,
    pub color: Color,
    pub description: String, // called strike, hit, strike out, ect.
    pub location: (f64, f64),
    pub index: u8,
    pub pitch_type: String, // fastball, slider, ect.
    pub speed: f64,
    pub strike_zone_bot: f64,
    pub strike_zone_top: f64,
}
To convert that pitch to a rectangle is quick and easy, as can be seen below. I
wasn’t sure what size of rectangle would look correct, so using the
ball_scale I tried a few different ones. Somehow it ended up at 1.0.
I also am converting the coordinates into inches. This is to match the rest of the display components.
/// Convert a pitch into a TUI Rectangle so it can be displayed in a Canvas.
pub fn as_rectangle(&self) -> Rectangle {
    let scale = 12f64; // feet to inches
    let ball_scale = 1.0;
    Rectangle {
        color: self.color,
        height: ball_scale,
        width: ball_scale,
        x: self.location.0 * scale,
        y: self.location.1 * scale,
    }
}
Finally, rendering a Pitch to
a tui-rs Canvas
is as follows:
// strike zone and pitch display
Canvas::default()
    .block(Block::default().borders(Borders::NONE))
    .paint(|ctx| {
        for pitch in &state.pitches.pitches {
            let ball = pitch.as_rectangle();
            ctx.draw(&ball);
            ctx.print(
                ball.x,
                ball.y,
                PITCH_IDX.get(pitch.index as usize).unwrap_or(&DEFAULT_IDX),
                pitch.color,
            )
        }
    })
    .x_bounds([-0.5 * total_width, 0.5 * total_width])
    .y_bounds([0.0, 60.0])
    .render(strikezone[1], buf);
where state.pitches.pitches is a Vec<Pitch>, and total_width is 48
(inches). The full source can be found
here.
Easy, right?
Up next, in part 2, I finish up the pitch display with the batter’s heatmap and the pitch information (speed, pitch type, result).
[0] - https://statsapi.mlb.com/api/v1.1/game/634021/feed/live
[1] - https://technology.mlblogs.com/developing-mlbs-automated-ball-strike-system-abs-d4f499deff31
[2] - https://baseballsavant.mlb.com/csv-docs#plate_x
[3] - https://baseballsavant.mlb.com/gamefeed?date=7/6/2021&gamePk=633352&chartType=pitch&legendType=pitchName&playerType=pitcher&inning=&count=&pitchHand=&batSide=&descFilter=&ptFilter=&resultFilter=&hf=liveAB#633352